
Solar energy refers to the radiation from the Sun that can be turned into energy using some technologies like photovoltaic (PV) systems to generate electricity, and thermal systems to generate heat water, or cook food.
In recent years, solar energy has been increasingly popular due to technological advancement and reduced costs. According to the calculation of the International Renewable Energy Agency (IRENA), over 800 GW of solar energy capacity will be installed globally by 2023. Also, the solar industry offers 3 million jobs globally, with an annual growth of 20% in recent years. Currently, China is in the leading position of being the world’s largest producer of solar energy compared to other countries.
By the time you have read this article, you will learn about countries that have the potential to access solar energy. Also, about different states in the United States of America where it is mostly used and installed with the highest capacity.
Mainly, solar power only works by converting the energy from the sun, which primarily depends upon locations that play a major role in determining the efficiency rate. However, there is a lot more to know about solar energy.
Countries Producing Maximum Solar Energy
Several countries are leading in producing maximum solar energy in terms of gigawatts by making significant investments and having favorable geographic and policy conditions. Here is a chart that depicts solar photovoltaic capacity’s all-time analysis by various countries in 2022.
These are the top three countries that generate maximum solar energy based on the PV capacity:
- China: 414.5 GW
- United States: 141.5 GW
- Japan: 84.7 GW
How China is the World’s Largest Producer of Solar Energy?
In 2023, China built an additional 216 gigawatts (GW) of solar energy and retained its position as the world’s largest producer. By the end of 2023, China’s total renewable installation capacity neared 2,919 GW, with the overall power generation capacity growing by 13.9%.
Experts estimated that China deployed 128.94 GW of new solar power in the first nine months of 2023, which includes an additional 15.78 GW in September.
Over the years, China has witnessed remarkable growth in the solar industry, starting from the installing capacity of 25 GW in 2010 to 549 GW by 2023.
In 2015, China overtook Germany’s position as the world’s largest producer of photovoltaic energy. Since then, it has dominated the industry by becoming the first nation to have installed more than 100 GW of photovoltaic capacity in 2017.
The main causes why China has been successful in higher solar energy production are its cutting edge Technology, Manufacturing Capabilities, and Global Expansion Strategies.
The Chinese government encourages the growth of solar power by providing significant subsidies, tax incentives, and favorable policies. Some of these popular schemes include the Golden Sun and the Top Runner Program. Moreover, public awareness about air pollution and its severe health consequences has widely spread in China, by opting for a clean energy source to mitigate environmental risks.
These are the estimated future goals of the solar industry in China within the following timeline:
- 2026: 80% of the world’s solar manufacturing capacity
- 2030: 1.37 TW of wind and solar capacity by surpassing the government’s objective of 1.2 TW
- 2060: Solar Power installation capacity by 2210 GW.
Solar Potential by Country
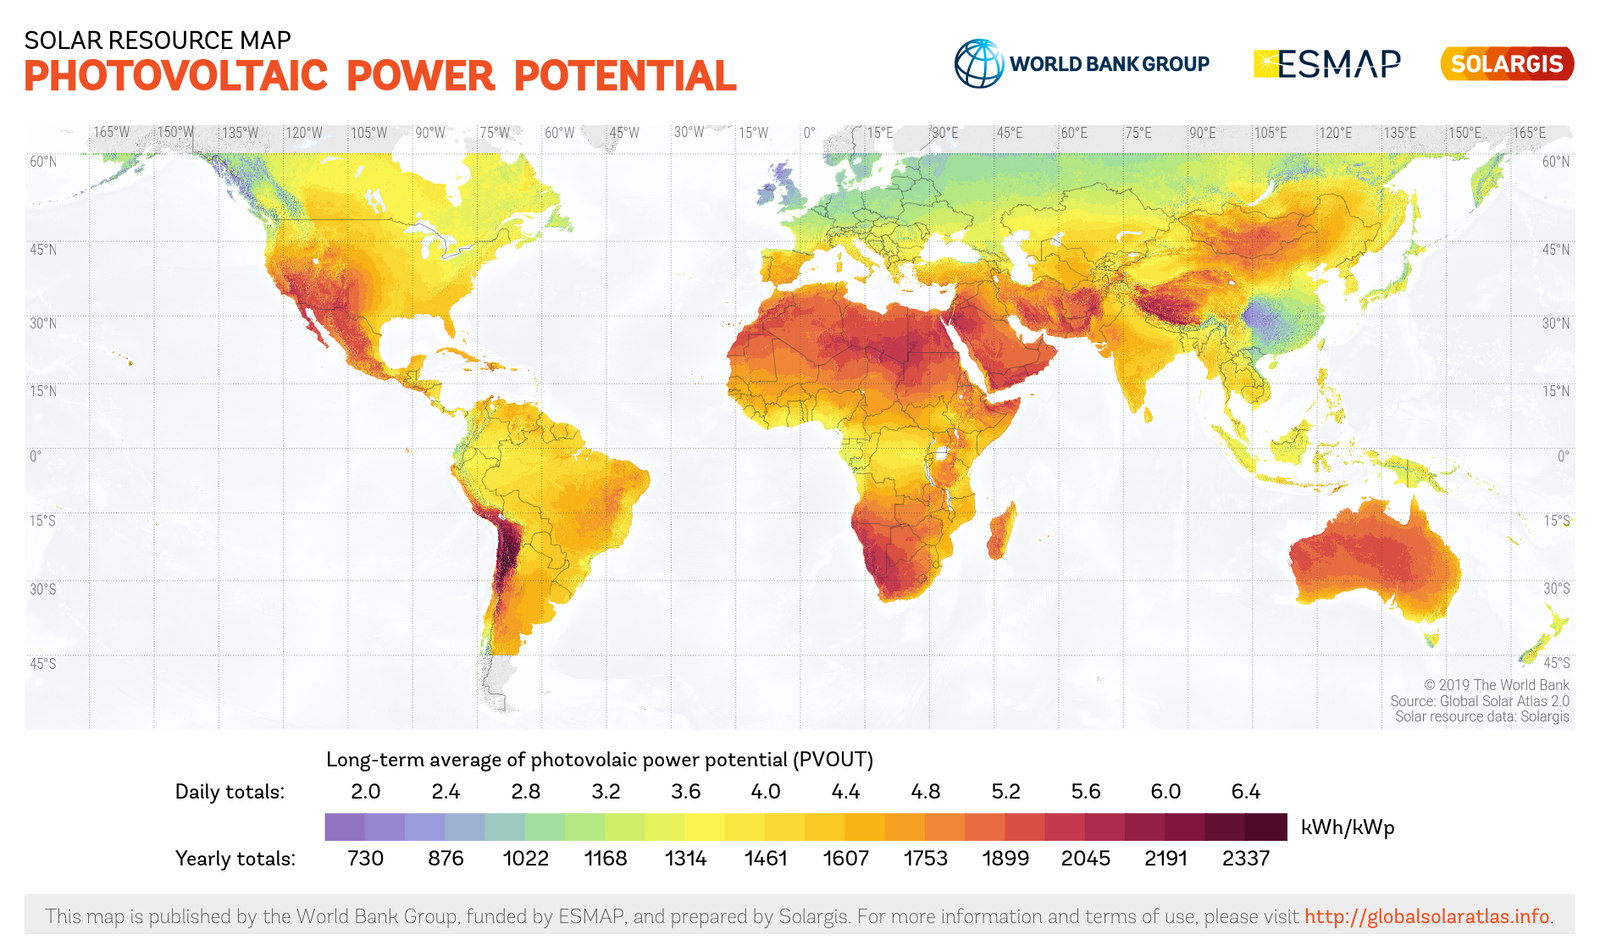
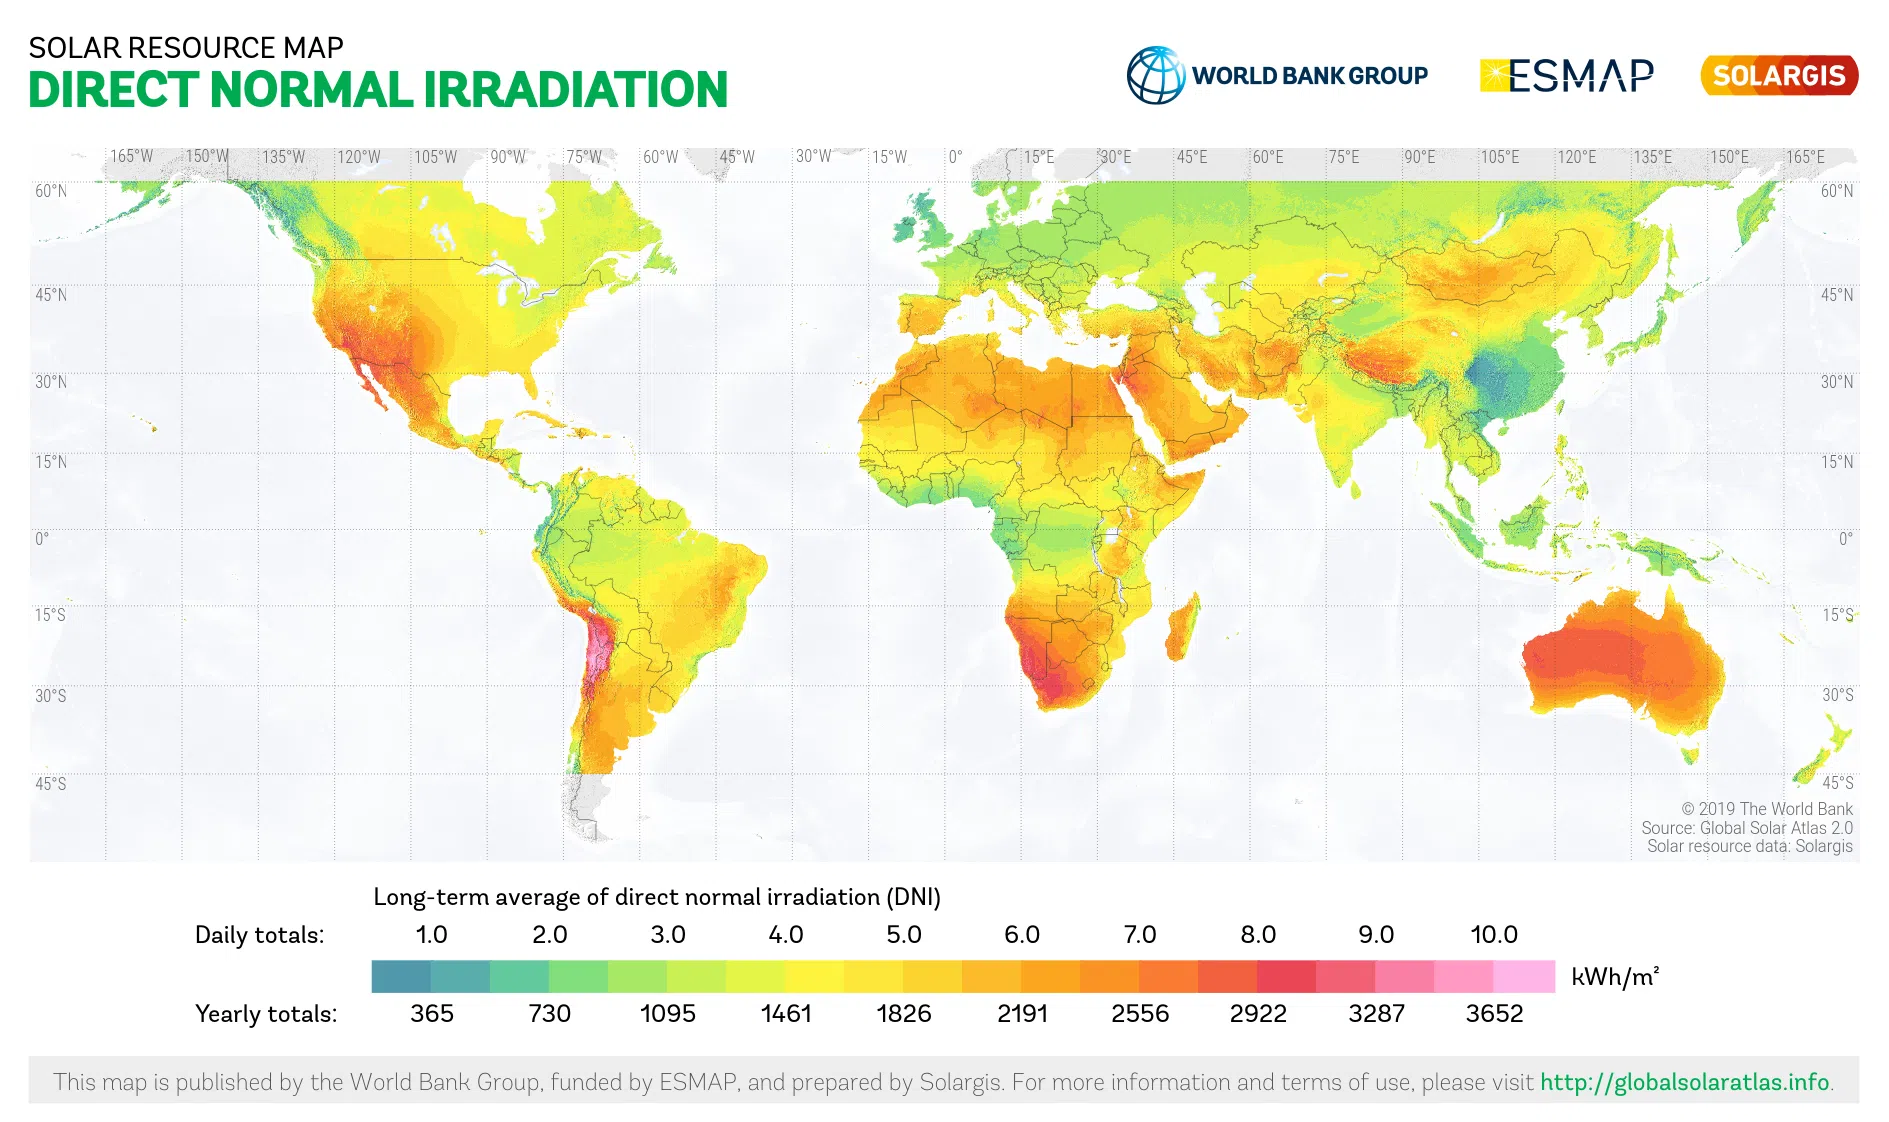
According to the Photovoltaic power potential map, around 70 countries in the world have excellent conditions for solar PV, with an average daily output exceeding 4.5 kWh/kWp. Especially countries in the Middle East, North Africa, and Sub-Saharan Africa regions dominate in this aspect. Similarly, a few other countries join the list such as Afghanistan, Argentina, Australia, Chile, Iran, Mexico, Mongolia, Pakistan, Peru, and many Pacific nations. On the other side, 93 % of the global population lives in countries with an average range of 3 to 5 kWh/kWp per day.
Several Factors influence the PV potential such as Climate, Land Availability, Technology, Cost of PV components, Maintenance and Operation, System Design, and Installation.
Mainly, location plays a crucial role in solar energy efficiency as panels perform well in minimum shading locations, which influences sunlight availability and climatic conditions. The local regulations and incentives can impact the feasibility and economic rate of solar projects.
These are the areas having the highest PV production potential due to the decrease in average cost and increase in production volumes of solar modules:
- China: 77.8%
- Vietnam: 6.4%
- Malaysia: 2.8%
- United States: 1.9%
- India: 1.9%
For more information you can check Global Solar Atlas.
Solar Energy in the United States of America
About 3.4% of the electricity generated in the US was powered by solar energy in 2023.
According to the survey of the National Renewable Energy Laboratory (NREL), about 3.9 million PV solar power systems were installed in the USA.
Solar energy is utilized across various sectors in the USA such as Residential, Commercial, Utility-scale, Agriculture, Government buildings and institutions, and Remote areas.
Which States Have the Most Number of Solar PV Installed?
Here are the top 10 leading states in the United States that have installed the maximum number of cumulative solar PV (Photovoltaic) capacity in Megawatts (MW) till 2022 as shown below with the approximate values:
- California: 39,729
- Texas: 17,247
- Florida: 10,111
- North Carolina: 8,179
- Arizona: 6,330
- Nevada: 5,366
- Georgia: 5,033
- New Jersey: 4,411
- Virginia: 4,286
- New York: 4,259
From the above stats, it becomes clear that California has the highest PV capacity than Texas by 22,482 MW and by the end of 2022 it had a power capacity of 39.7 GW.
Frequently Asked Questions:-
Who Uses Solar Energy and for What Purpose?
As discussed earlier, various sectors use solar energy for a multitude of purposes, such as:
- Residential: Many homeowners use solar energy by installing panels on rooftops to generate electricity by reducing dependence on the grid and lowering the electricity bills.
- Businesses: Rooftop solar installations or ground-mounted solar panels are used by small businesses to large companies to power their equipment.
- Industries: Solar power for electricity or heat generation is utilized by various industries such as manufacturing, agriculture, and food processing which helps in reducing carbon emissions and energy costs.
There are different uses of solar energy which include:
- Electricity Generation: The PV panels help in electricity generation by converting the sun’s energy through the photovoltaic process.
- Water and Space Heating: Solar thermal systems capture sunlight to heat water as well as the living space by circulating the hot air.
- Charging EVs: Solar inverters convert DC into AC that can be used for charging electric vehicles.
- Desalination: In regions where there is water scarcity, solar energy helps in the desalination process by converting saltwater into freshwater.
- Water pumping: Solar-powered pumps used for irrigation in agriculture provide sustainable solutions in remote or off-grid locations.
How Does Location Play an Important Role in Solar Energy Efficiency?
Location can play a main role in determining the solar energy efficiency by considering these factors:
- Solar Irradiance: The higher rate of sunlight received per unit area of a particular location, and the regions closer to the equator have increased solar irradiance and generate more electricity.
- Latitude: Typically, the sun’s angle varies depending on the latitude and time of the year.
- Solar Angles: Locations closer to the equator have larger solar angles, which results in higher energy production.
- Climatic conditions: The solar panel output is reduced due to humidity, air pollution, and large cloud cover.
- Shading: Solar energy generation is reduced due to shading from trees, buildings, or other obstructions.
What is the Solar Capacity of the United States?
141.5 GW is the solar capacity of the United States according to survey reports, positioned in 2nd place after China, which has 414.5 GW.
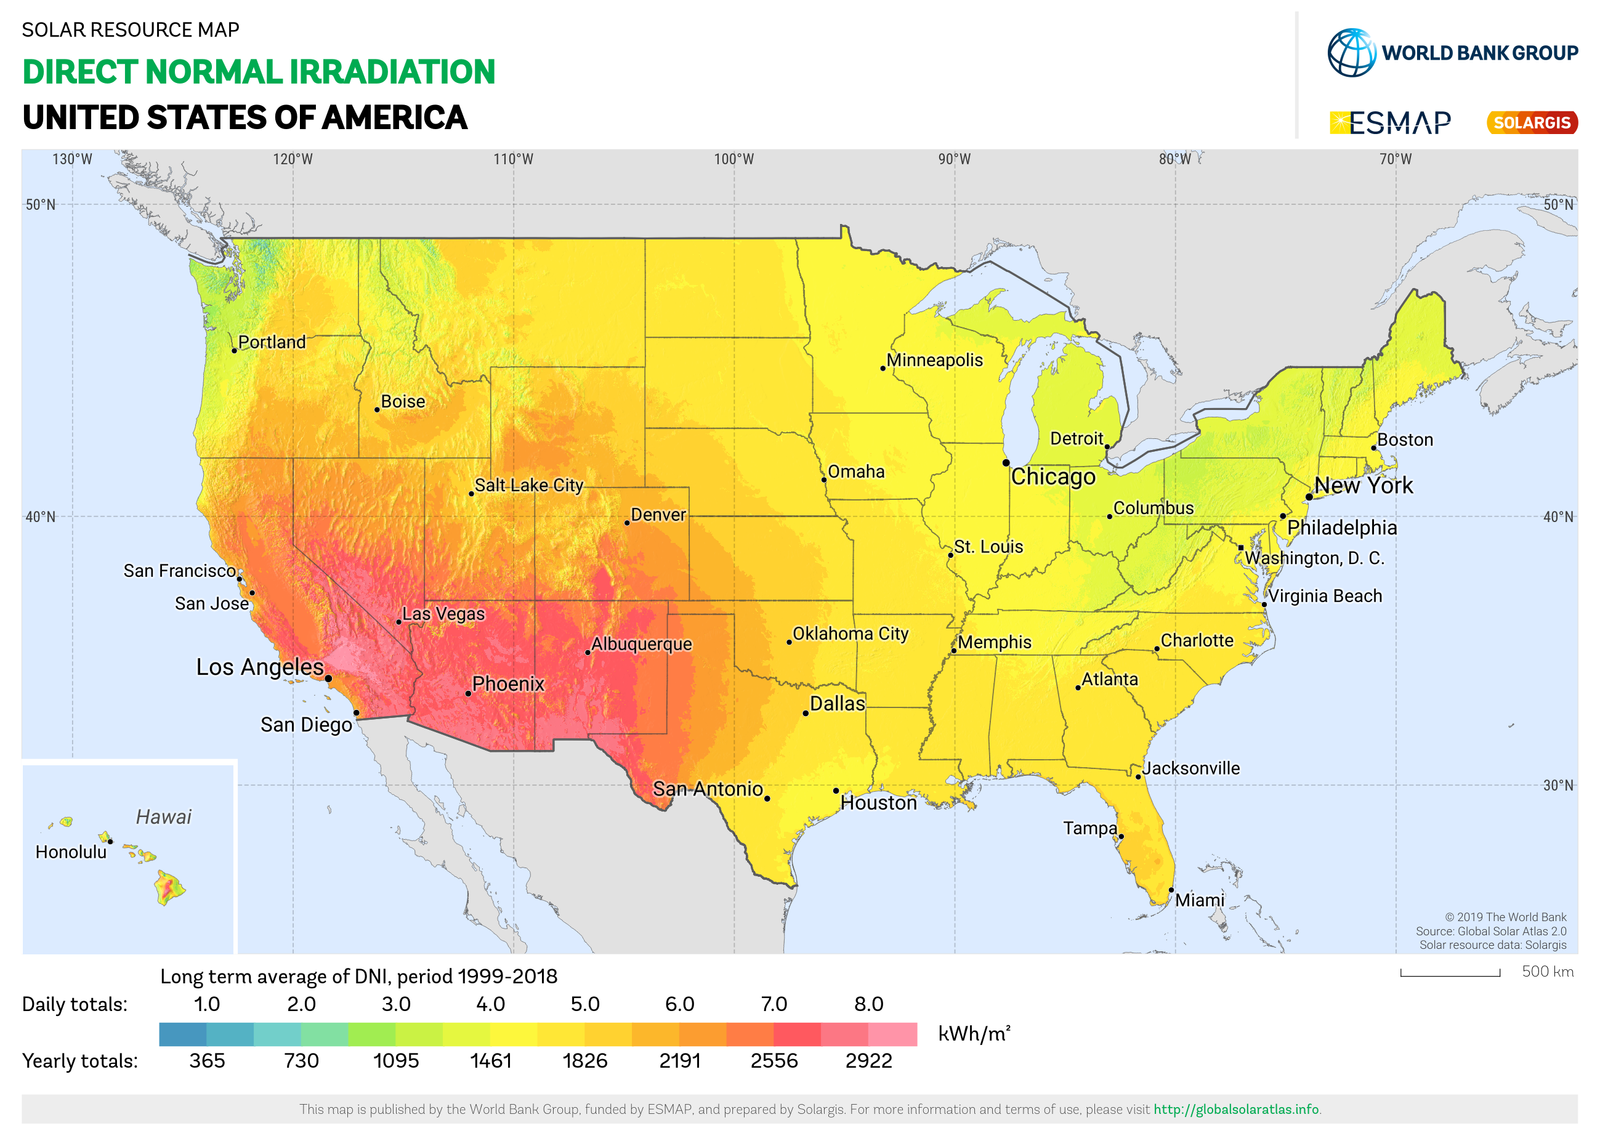
Where is Solar Energy Mostly Used in the United States?
California, North Carolina, and Arizona are the regions of the United States where solar energy is mostly used. Though Texas and Florida have the maximum number of solar PV (Photovoltaic) capacity, the usage is less compared to Carolina, and Arizona.
Ray is an avid reader and writer with over 25 years of experience serving various domestic and multinational private and public energy companies in the USA.